Section "Monitoring"
The “Monitoring” section of the IoT platform is designed to monitor the performance of equipment at all stages of its life cycle - from commissioning to disposal. It provides:
- Automatic collection of data on the state of devices;
- Failure analysis based on self-diagnostics of devices;
- Generation of reports for prompt decision-making.
Section Functionality
Some devices support the self-diagnostic function by transmitting data about their status (temperature, charge level, communication errors, etc.) to the system. The IoT platform processes this information and generates analytical samples, including the following types of reports:
-
Metering Device Connectivity Status Report
Displays device connection statistics to the server, identifying connectivity issues. -
Communication Session Analysis Report
Contains data on the duration, frequency and success of data exchange sessions. -
Zero Consumption Report
It records cases of no consumption of the resource, which helps to detect:- Malfunctions of metering devices;
- Incorrect settings;
- Attempts of unauthorized interference.
Benefits of usage
- Proactive troubleshooting - early detection of problems reduces downtime.
- Maintenance Optimization - reports allow you to schedule repairs and replacements.
- Improved data accuracy - monitoring eliminates incorrect readings.
Reports
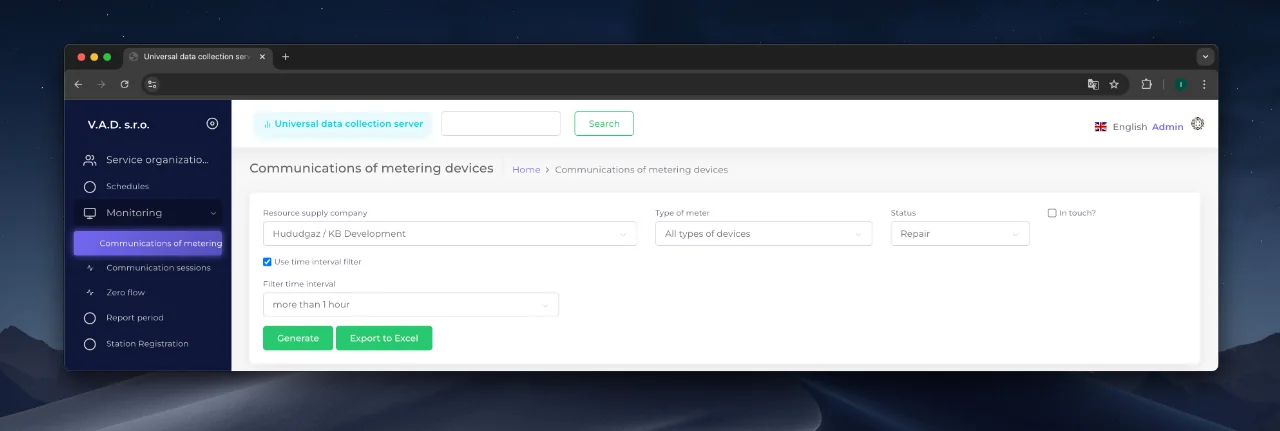
Communication Status of Metering Units
This report analyzes the operation of metering devices based on the communication sessions of telemetry units with the server. It identifies devices that deviate from the specified schedule and generates lists of problem units.
Operating principle
-
Data collection:
For each communication session, the following is recorded in the system log:- Session date and time;
- Connection parameters (e.g. duration, signal quality);
- Connection status.
- For more information on the data structure, see the section «Metering unit card».
-
Report generation:
Based on the log, the system generates a report that can be:- Viewed on the screen (button «Generate»);
- Exported to Excel (button «Export»).

Request form fields
The request includes the following parameters:
- Supplying Company - selection of the supplier branch to search for.
- Meter Type - filter by device type (e.g. meter, corrector).
- Status - status of devices (e.g. working, sealed, repaired).
- Time interval:
- Manual input - specify start and end dates.
- System Templates - preset time ranges:
| Template | Description |
|---|---|
| Over an hour | Missed sessions within 1-12 hours. |
| Over 12 hours | Problems lasting 12-24 hours. |
| More than 24 hours | 1 day to 1 week. |
| Over a week | No communication for 7 to 30 days. |
| More than a month | All cases over 30 days. |
- Flag “In touch? ” - inverts the request. When activated, it displays successful sessions for the selected period, which helps:
- Verify that the time on the equipment is up to date;
- Verify that the data is being transmitted correctly.
Usage Example
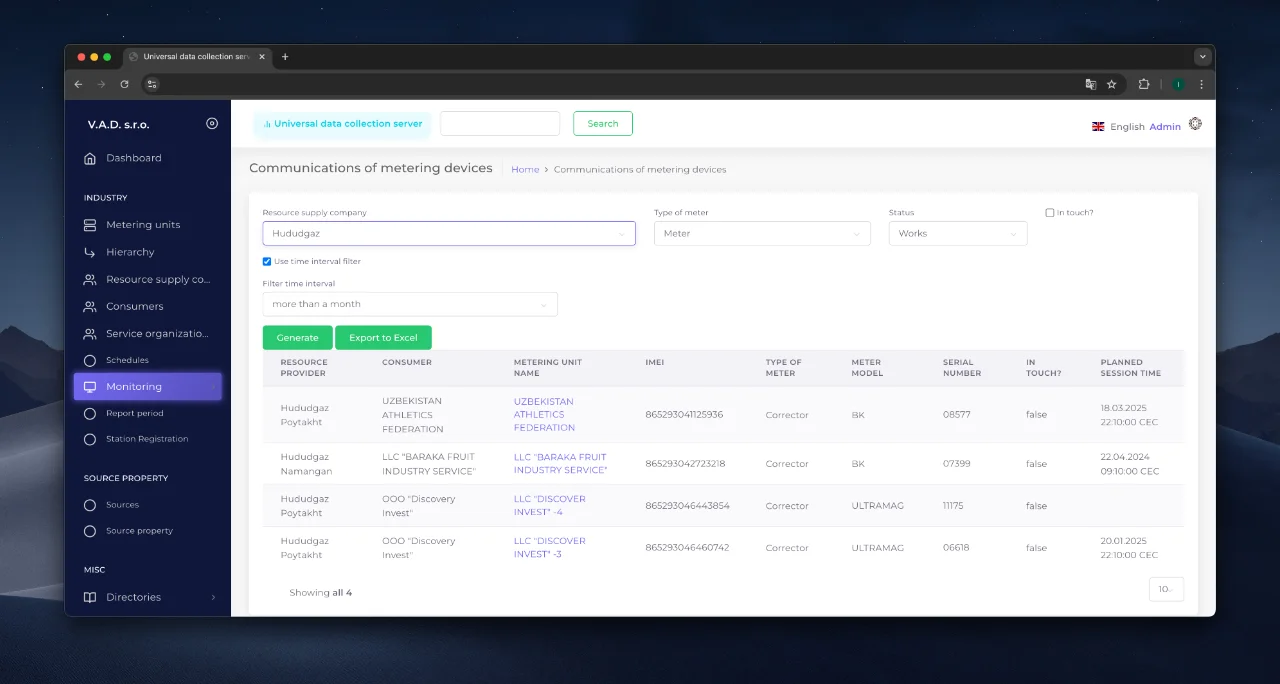
Task: Find all gas meters of Hududgaz branch that have been out of contact for more than a month.
Actions:
- Select Hududgaz in the “Resource supplying company ” field.
- In “Type of metering device ‘ select ’Meter”.
- In the interval templates select “More than a month ”.
- Click “Generate ”.
*Result: The system will show a table with the eligible devices (example in the figure below).

Communication Session Analysis
This report identifies metering problems by analyzing the communication sessions between the telemetry units and the server. It allows you to:
- Determine the causes of failures (device, network, server);
- Filter sessions by status for quick diagnostics;
- Proceed to detailed analysis of problematic units.
Request form

Customization parameters:
- Resource supplying company - selection of the branch of the energy resource supplier.
- Meter type - filter by device type (meter, corrector, etc.).
- State - status of the metering device.
- Session Status - select one or more statuses from the list:
Classification of Session Statuses
IoT platform distinguishes 9 regulated statuses for accurate diagnostics:
| Status | Description | Localization of the problem |
|---|---|---|
| Successful | Data successfully received. | - |
| Receiving data | Active data exchange process. | - |
| Lack of archive | The telemetry unit has not transmitted an archive of data. | IoT device |
| Data transmission failure | Network layer failure (unstable link). | Communication channel |
| Unspecified | IoT platform could not interpret the received data. | IoT device / IoT platform |
| Broadcast socket error | Communication failure between IoT platform and IoT device. | Communication channel / IoT platform |
| ** No communication with the device** | No communication between the IoT device and the terminal equipment. | IoT device |
| Communication error with the TBT | Communication failure between the IoT platform and the telemetry unit (BBT). | Communication channel / IoT platform |
| Channel noise | Data distortion due to noise in the communication channel. | IoT device/Communication channel |
Example Analysis
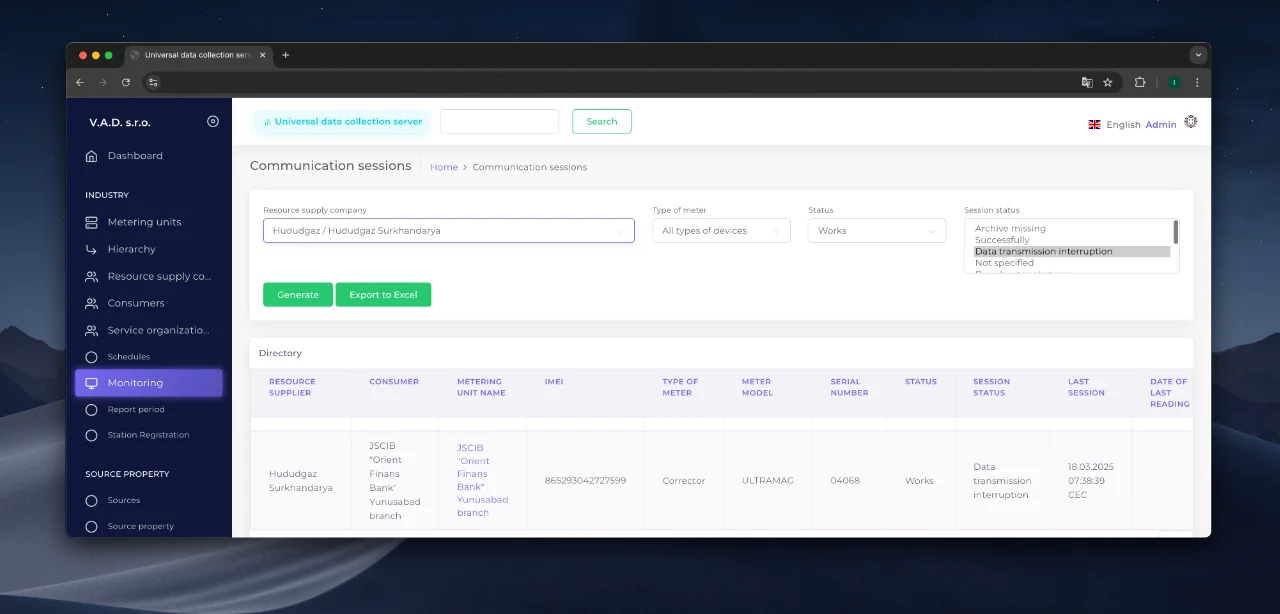
Task: Find all metering units of Hududgaz Surkhandarya branch with the status “Data transmission failure”.
Actions:
- In the query form:
- Select “Resource Supply Company” → Hududgaz Surkhandarya.
- In “Communication Session Status”, check ”Data Transfer Failure”.
- Click “Generate”.
**Result:
The IoT platform will display a list of problematic devices.

Detailed diagnostics
- Click on the unit name in the results list.
- In the unit card, click the “Communication sessions” tab.
- Analyze the session history:
- Failure Frequency;
- Timestamps;
- Related statuses.
Example Output:
If sessions with the status “Data Transfer Failure” are recurring during peak network load hours - bandwidth problems are likely.
Zero Flow
This report is designed to detect anomalies in the operation of metering devices of industrial consumers equipped with flow correction units. It allows you to:
- Detect cases of zero resource consumption;
- Analyze the causes of incorrect readings;
- Promptly react to potential failures or violations.
Principle of operation
- Data source:
The system analyzes the Average Daily Archive of consumption collected from metering devices. - Selection Criterion:
A meter station is included in the report if the Operating Volume per Period field in the archive is 0.
Customizing a request

Parameters:
- Supplying Company - select the supplier branch to analyze.
*Form Feature:
Unlike other reports in the module, only branch selection is available here. This is due to the focus on industrial facilities, where zero consumption often indicates a critical malfunction or production stoppage.