Section "Reports"
Basic report types and analysis capabilities
Modern data processing systems are designed not only to collect information, but also to convert it into structured, intuitive reports. These reports serve as a basis for making decisions, identifying trends and optimizing business processes. This section describes the key types of reporting available in the system, as well as the analysis tools that allow you to transform raw data into valuable insights.
Flexible reporting for different tasks
The system supports generation of reports of the following categories:
- Operational reports - real-time data.
- Analytical reports - summaries with grouping, filtering and visualization (graphs, charts).
- Custom Reports - customizable templates for unique user requirements.
Data analysis capabilities
In addition to standard reporting, the system provides tools for in-depth analysis:
- Data Comparison by period, region or category.
- Prediction based on historical data (trends, risks).
- Detailing to the level of individual values.
- Export results in XLSX, PDF formats.
Security and personalization
Access to reports is governed by a role-based model: user rights determine data visibility and functionality. Administrators can customize templates, access levels and automatic scheduled report generation.
Tip
This section will help you to maximize the analytical potential of the system by adapting the reporting to the required goals and objectives.
“Reporting Periods” Tool
Purpose
The “Reporting Periods” tool allows you to automate the generation of reports by Accounting Nodes in the IoT platform. The module is available exclusively to Administrator and includes two key settings:
- Defining contract days.
- Customization of reporting periods.
Contract Days Configuration
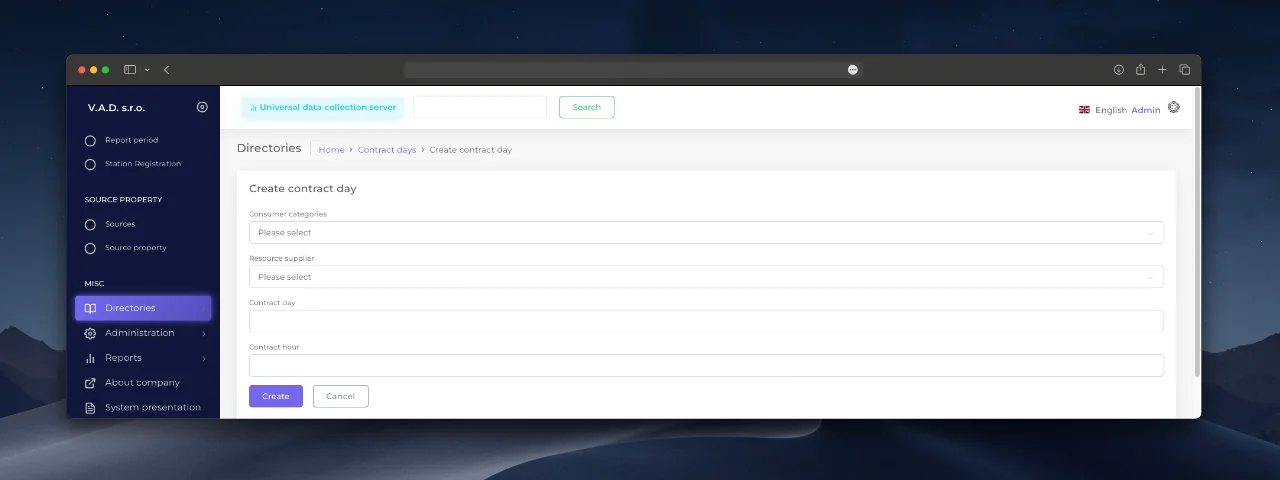
Configuration of contract days parameters is performed in Section “Directory” → *Contract Days element.
Fields to be filled in:
- Category of Consumption - the Consumer’s category (e.g. industrial facilities, population).
- Resource supplying company - Supplier’s branch for which automatic generation is activated.
- Contract day - calendar day of starting generation of reports.
- Contract hour - exact time (in hours) of operation execution.

Reporting Period Setup
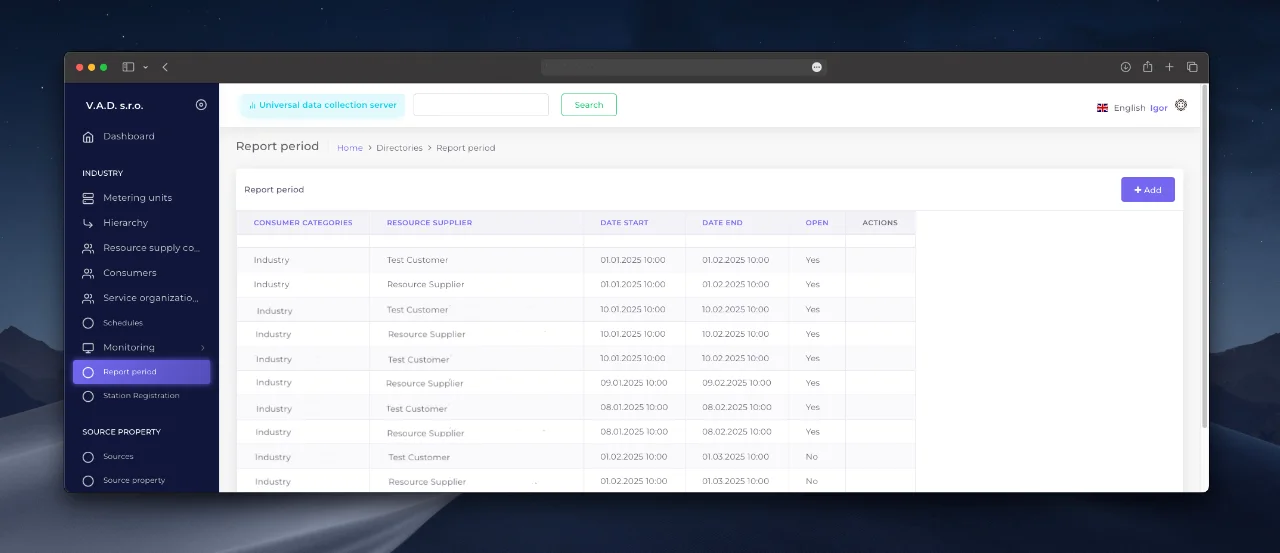
To create a period, navigate to the Reporting Periods section on the main navigation bar of the IoT platform and follow the steps below:
- Click the “Add ” button.
- Specify the period parameters based on the data from the Contract Days directory.
- Confirm the action - the system will create a task for automatic download.

Particularities of work:
- Active periods are marked with “Yes ‘ in the ’Open ” column.
- When creating a new period the previous one is automatically closed.
- The date interval is formed on the basis of the start and end day from the directory.

Access to reports
Prepared reports are available in the Metering Unit card → tab “Reports ”. See Metering Node Card for more details.
“Period Summary Report” Tool
Purpose of the report
The report provides summary data on the consumed resource volumes for the selected period in the Supplier/Consumer breakdown.
Note
Unlike other reports, the “Contract Hour ” parameter is not used here - the data is aggregated by day (from 00:00).
Report generation
- Go to the “Reports ‘ module → select the ’Summary report ” option.
- Fill in the fields of the request form:
- Supplying Company - select the Supplier’s branch.
- Consumer - specify the organization or object of consumption.
- Time interval - specify the interval in the format:
- *Date from - start date of the period,
- Date to - end date of the period.
- Click “Generate ” - the system will create an Excel file with the data.

Report Features
- The report includes:
- Name of Supplier and Consumer,
- Period of analysis,
- Resource volume (in system units).
- Data is automatically grouped by day, making it easy to compare daily figures.
Processing result
The generated Excel file is saved to the user’s local folder or becomes available for download through the system interface. To generate the report again with different parameters, update the data in the form.
“Export IMUS” Tool
Function assignment
The “IMUS” format allows you to transfer data from the IoT platform to external environments (e.g. regulatory platforms or partner systems). The export is performed via a specialized transport file that complies with industry standards.
The order of data unloading
- Go to “Reports ‘ → select the ’Export IMUS” subsection.
- Click the “Export IMUS ” button.
- Wait for the request processing to complete.

Report generation window in IMUS format.
Transaction Result
The system generates a transport file in IMUS format, which contains:
- Uset node data for the selected period,
- Resource consumption metrics,
- Service information.
The file is saved to the default downloads folder or becomes available for download through the interface.
“Consumption Control” Tool
Report purpose
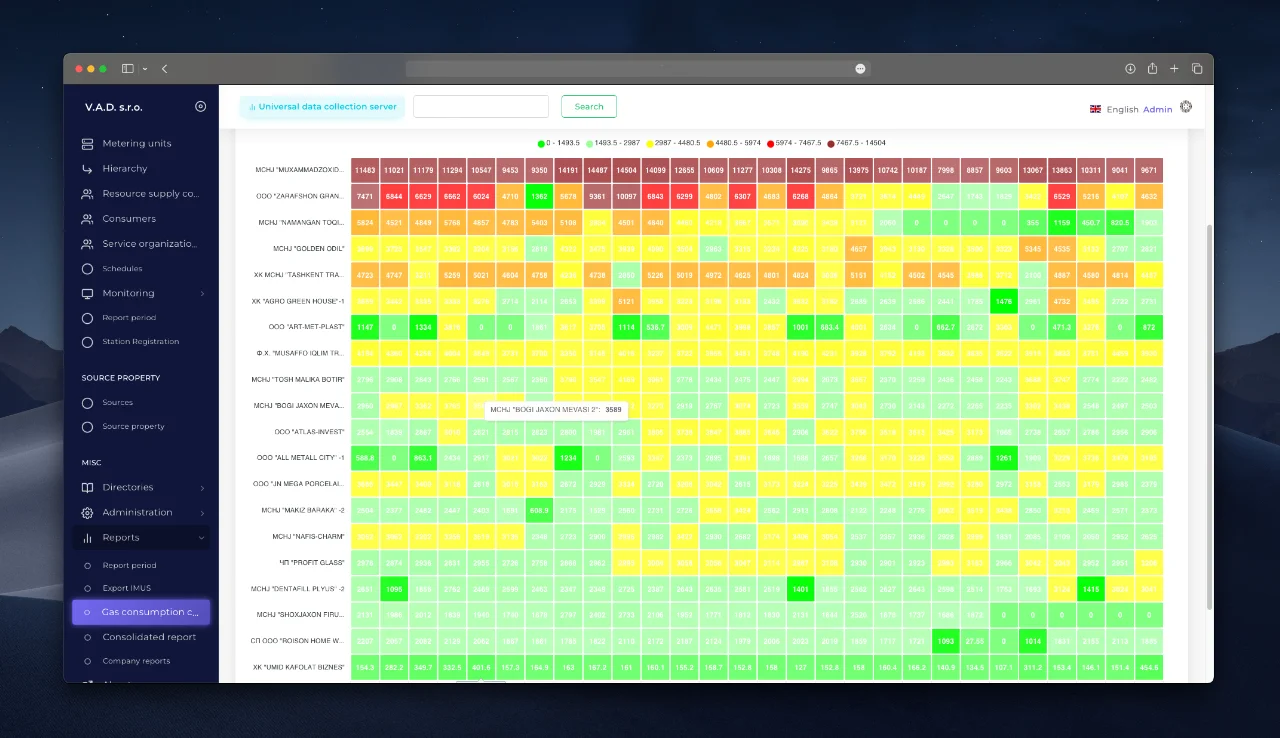
The “Consumption Control” tool is designed for in-depth analysis of resource consumption, automatic detection of anomalies (e.g., spikes or drops) and data visualization. The tool helps to:
- Promptly identify abnormal situations.
- Compare performance between metering nodes.
- Optimize resource allocation.
Report generation procedure
- Go to the “Reports ‘ section → select the ’Consumption Control ” subsection.
- Fill in the request parameters:
- Archive Type - select the type of archive to be analyzed (e.g. “Daily Indicators”).
- Channel - data source.
- Date from / Date to - analysis period.
- Range of weights - allowable deviation from the norm in percent (e.g. ±15%).
- Exclude null values - filter to cut off null data.
- Click Generate - the system will generate a report with color-coded anomalies.

Types of analytics
Customized analytics
- Point search - ability to select a specific metering node for detailed study.
- Gradient visualization - color scale (light to dark) shows the level of deviation from the norm.

Group analytics
- Consumer Importance slider - filtering nodes by their contribution to total consumption.
- *Consumer Importance is calculated as the ratio of the node’s median consumption to the maximum median in the company.
- Dynamic Ranges - the system automatically defines limits for the color scale:
- Bright red - critical anomalies (exceeding the weight range).
- Green - normal values.
- Interactivity:
- Clicking on the legend highlights the corresponding data on the graph.
- Sorting of nodes by anomaly level (top - most problematic).
“Summary Report” Tool
Purpose
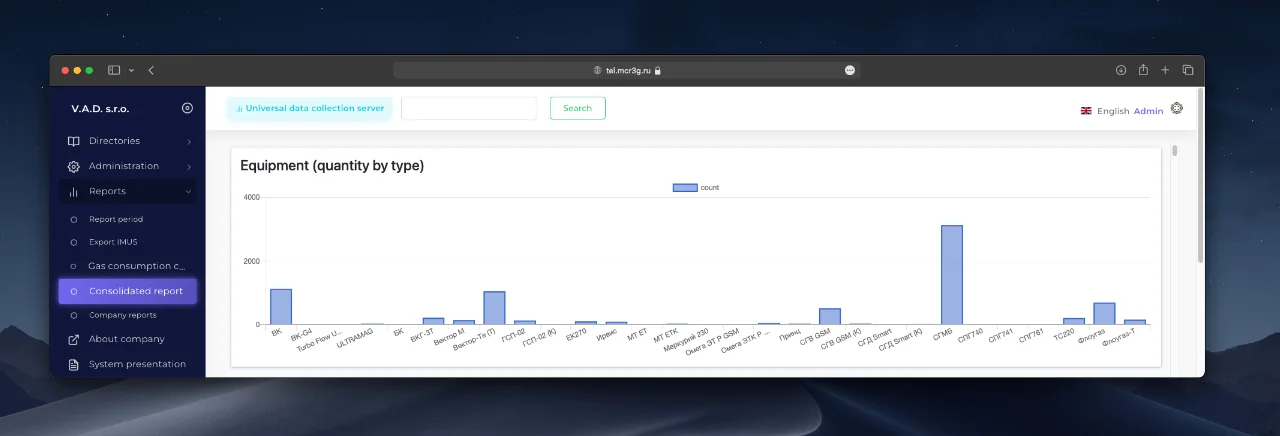
The Summary Report provides summarized analysis of system data by combining key metrics across equipment, consumption, and telemetry. It is a versatile tool for monitoring system-wide performance and identifying global trends.
Report Content
The report displays the following data:
- Equipment
- *Number and type of devices: number of metering devices, their models and categories (e.g. gas meters, electricity meters).
- *Distribution by service organization: which company is responsible for operation.
- Metering device statistics
- Type classification: grouping by technical characteristics.
- *State of devices: share of devices in operating/emergency mode.
- Consumption analysis
- *Resource volumes: total consumption by category (industrial, residential).
- *Comparison of periods: Consumption dynamics (month to month, year to year).
- Telemetry blocks
- *Number of active units: devices transmitting data in real time.

“Company Reports” Tool
Purpose
The tool provides access to specialized reports that help to evaluate the efficiency of service organizations, monitor the condition of equipment and analyze resource consumption. Reports are generated at the user’s request with the possibility of customization for specific tasks.
Available report types
- Report on abnormal situations
- Analysis of emergencies and failures of metering devices in the context of the service organization.
- Number of equipment
- Statistics of installed devices by types and service companies.
- Number of metering devices
- Data on devices assigned to a particular organization.
- Monthly consumption
- Details of resource consumption (gas, electricity) for a month by selected metering units.
- Summary report
- Comprehensive analytics of consumption grouped by region, supplier and period.

Procedure for working with reports
- Select the desired report from the list in the subsection.
- Click on the report name - the system will display the data in tabular or graphical form.