AI Heat Maps
Heat maps are a data visualization tool that allows you to display the intensity or density of certain parameters. In the context of the “Global Secure IoT Platform”, heat maps are used to analyze the distribution of data over time.
Probabilistic Analysis of Resource Consumption Patterns and Data Visualization
Probabilistic analysis of resource consumption patterns and data visualization is an important part of the “Secure IoT Telemetry Data Collection Platform”. It provides the ability to collect, analyze and visualize resource consumption-related data, and plays a key role in optimizing resource management.
Important
The main objective of the predictive analytics module is to identify patterns and trends in resource consumption, as well as to provide information necessary for making more effective decisions in resource supply management.
The module uses probabilistic analysis methods to identify hidden patterns in resource consumption data, including searching for seasonal patterns, analyzing dependencies on external factors, and forecasting future resource consumption.
Key Features
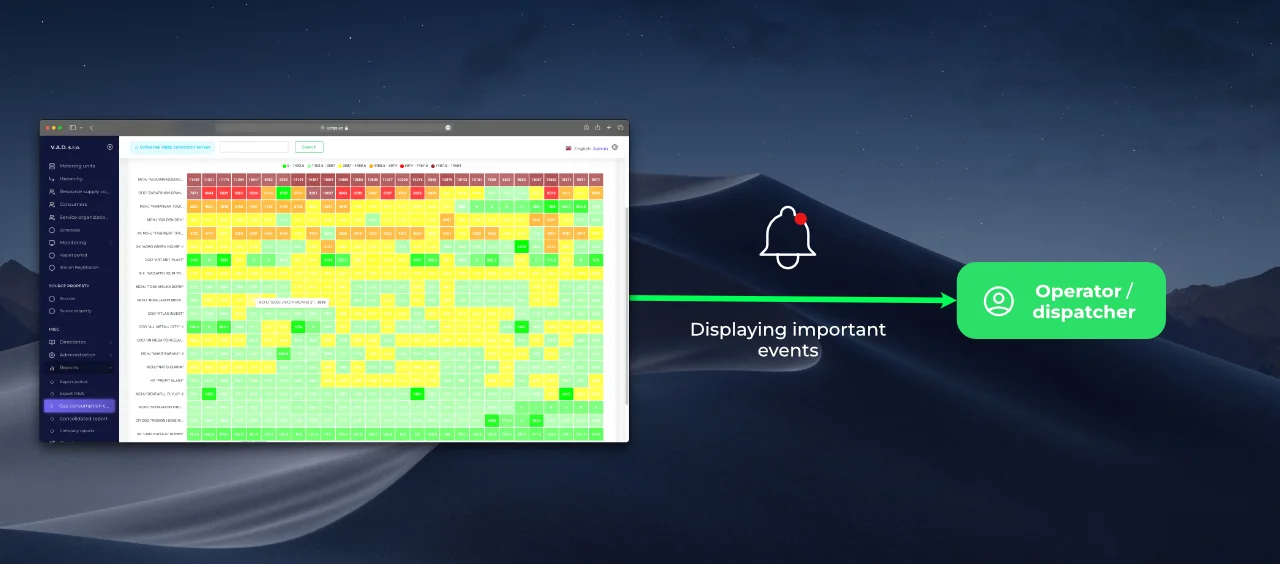
The module provides the ability to visualize resource consumption data using color tables. Data visualization using color tables allows you to visually present information on resource consumption. In the tables, each cell contains flow rate/pressure/temperature or another selected parameter and takes a certain color depending on the degree of deviation of the value from the average, expected, or time-related value. For example, you can use a palette from green to red, where cells with low deviation will be displayed in green, and cells with high deviation will be displayed in red.
Color tables and grouping by resource consumption categories allow dispatchers and metrologists to quickly visualize and analyze data on resource consumption. They can easily spot high or low values, anomalies or patterns in consumption by simply looking at the table. In addition, color visualization allows you to quickly compare values in different cells and detect patterns or trends.
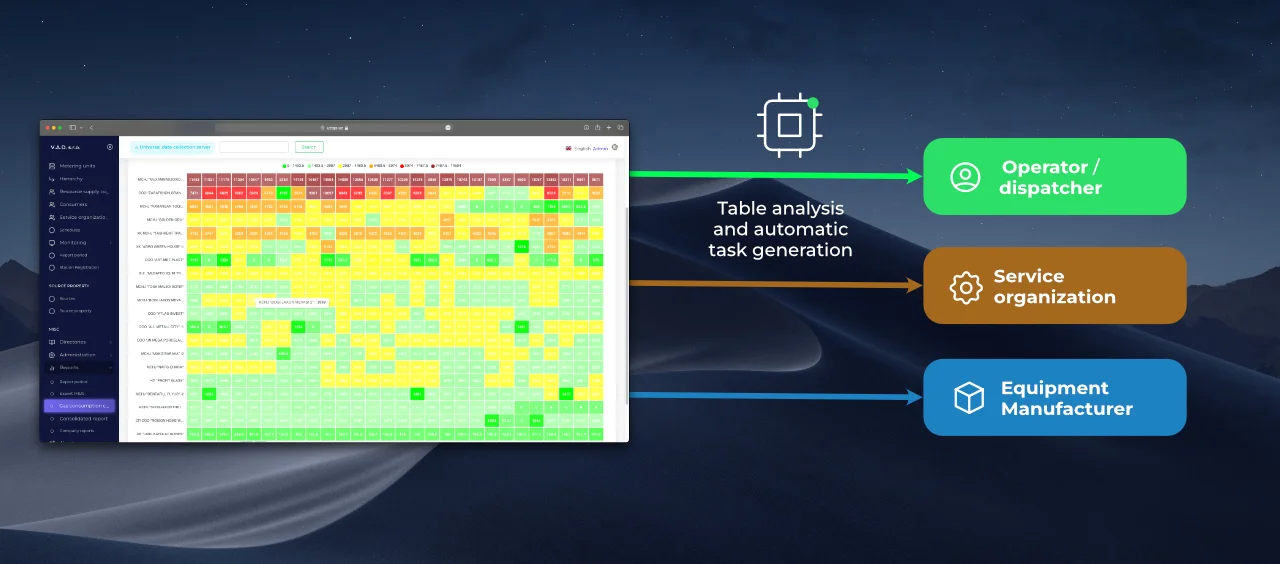
The module is also equipped with artificial intelligence algorithms that allow you to form behavioral features of data sets or deviations. Artificial intelligence is able to identify complex patterns and dependencies, which helps to predict future resource consumption and detect anomalies in the resource consumption system “on the fly”. This allows you to quickly respond to problems and effectively plan resource supply.
Management levels
- Classic – decision-making assistance system.
- Use of artificial intelligence (AI) – preparation and issuance of actions (instructions) to personnel responsible for the operation of the energy resource metering unit, both from the metrology and technical departments, and from service companies and equipment manufacturers.


Application of heat maps
Analyzing resource consumption
- Example: Visualization of resource consumption by consumer or metering device.
- Benefits: Quickly identify areas with abnormally high or low consumption, pressure, temperature.
Equipment Condition Monitoring
- Example: Display equipment status (e.g., pressure, temperature) by consumer.
- Benefits: Ability to respond quickly to emergency situations.
Resource Planning
- Example: Network load analysis for upgrade planning.
- Benefits: Optimization of resource allocation.
Example of using heat maps
|
|
- x: Timestamp.
- y: Intensity of the parameter (e.g. resource consumption).
